User guide
Welcome to the user guide for SMARTSexplore, a web-based interactive visual analysis app for the exploration of chemical pattern networks.
This user guide serves as a collection of detailed explanations for all features that SMARTSexplore offers.
Installation
Note
These steps are only required if you want to run your own instance of SMARTSexplore on your own machine. If you have access to a running instance of SMARTSexplore, you can skip ahead to the Overview.
Installing the backend dependencies
SMARTSexplore requires Python 3.8 or later. After you’ve installed an appropriate Python version, please create a new virtual environment, then activate it:
python3 -m venv venv
source venv/bin/activate
Now, install the project and its dependencies:
python setup.py install
Installing the frontend dependencies
For generating the frontend code, you need a working npm installation.
We recommend using
nvm to install
an isolated version of npm.
After doing so, install all dependencies via:
npm install
Then, build the frontend code:
npm run build
Building documentation
After following the steps to install the backend and frontend dependencies, you can generate browsable HTML documentation by first installing the jsdoc package:
npm install -g jsdoc
Then building the documentation:
python setup.py build_sphinx
and opening the file build/sphinx/html/index.html. It includes a user guide, a developer guide,
and documentation for the backend and frontend APIs.
Installing required external programs
For making molecule uploads work in the frontend, please place
licensed versions of the following NAOMI programs into the bin/
folder:
mol2svgSMARTSMoleculeMatcher(formerly known asstructure_preprocessor)
If you wish to add your own SMARTS data, it’s required you also place the following NAOMI programs there:
SMARTScompareSMARTScompareViewer
Generating the backend data
To initialize the database, run
flask db init
Then, add all SMARTS libraries from the data folder:
flask smarts add_libraries data/*.smarts
Now, SMARTS-SMARTS subset edges need to be calculated and stored in the database:
flask smarts calculate_edges SubsetOfFirst
After doing so, let the software draw all SMARTS and SMARTS-SMARTS edges:
flask smarts draw_all_smarts
flask smarts draw_all_subsets
The backend data is now ready.
Starting the server
After following the steps above, you can start the server via
flask run
and access the SMARTSexplore application at http://localhost:5000.
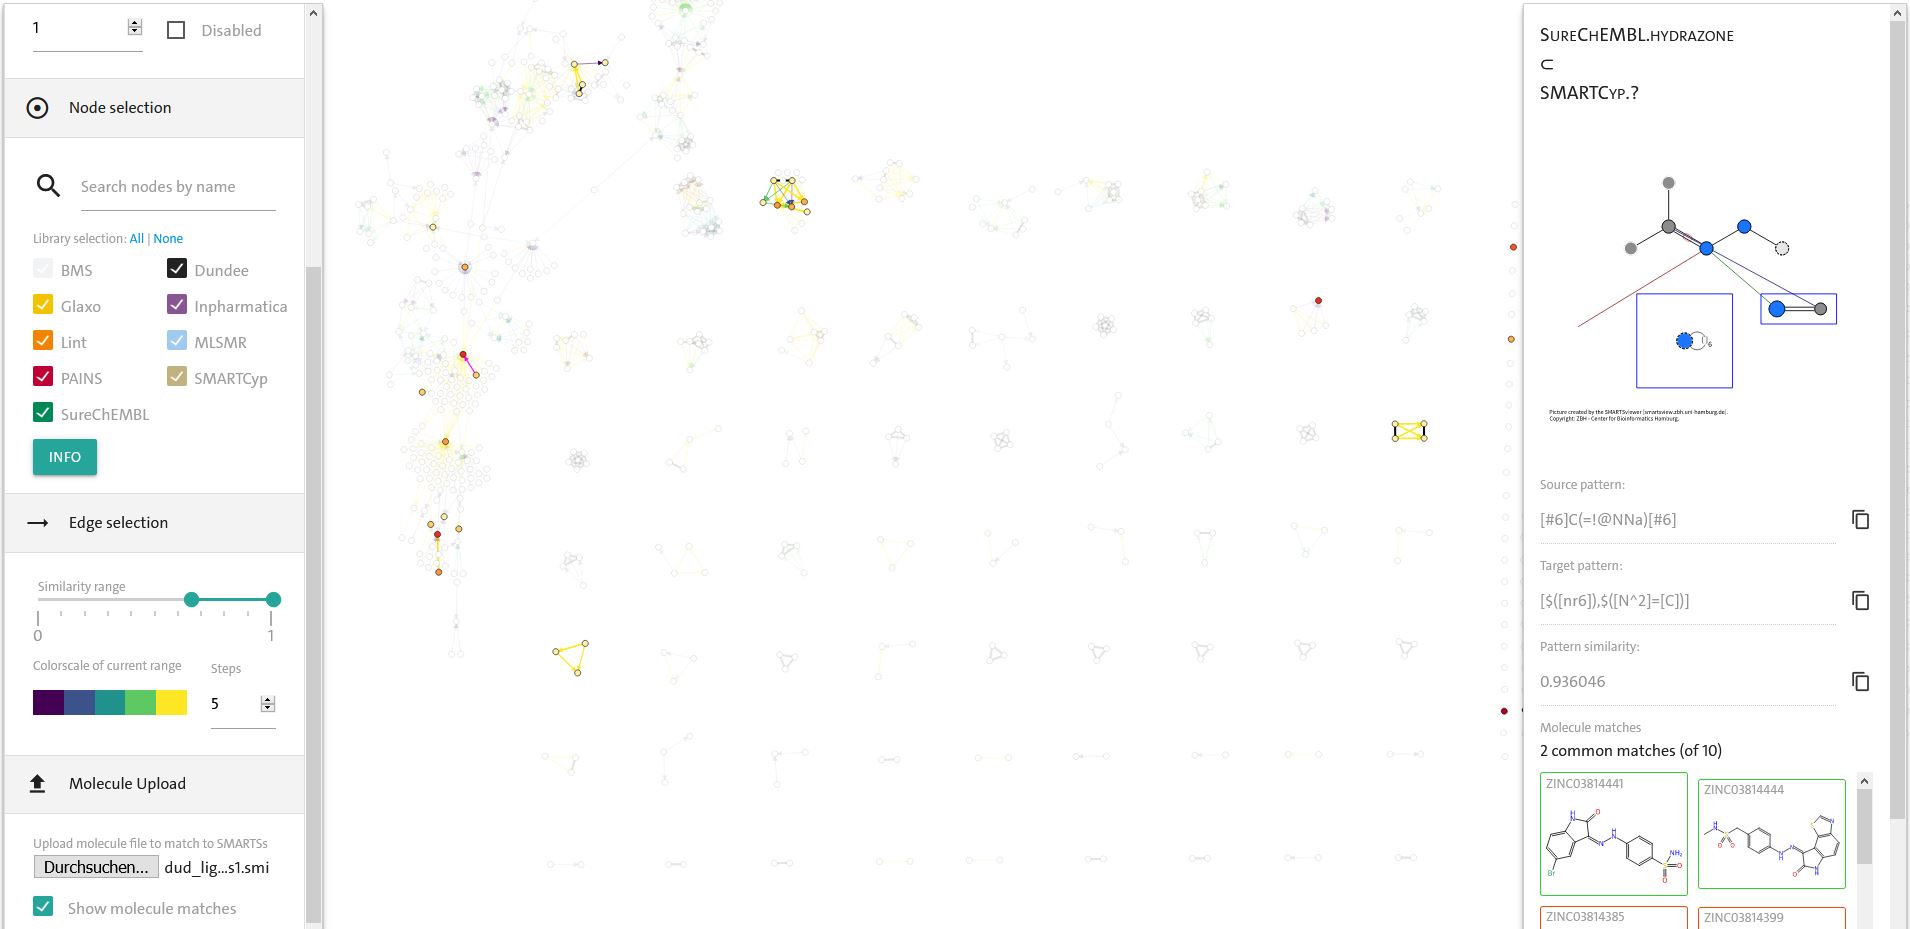
Overview
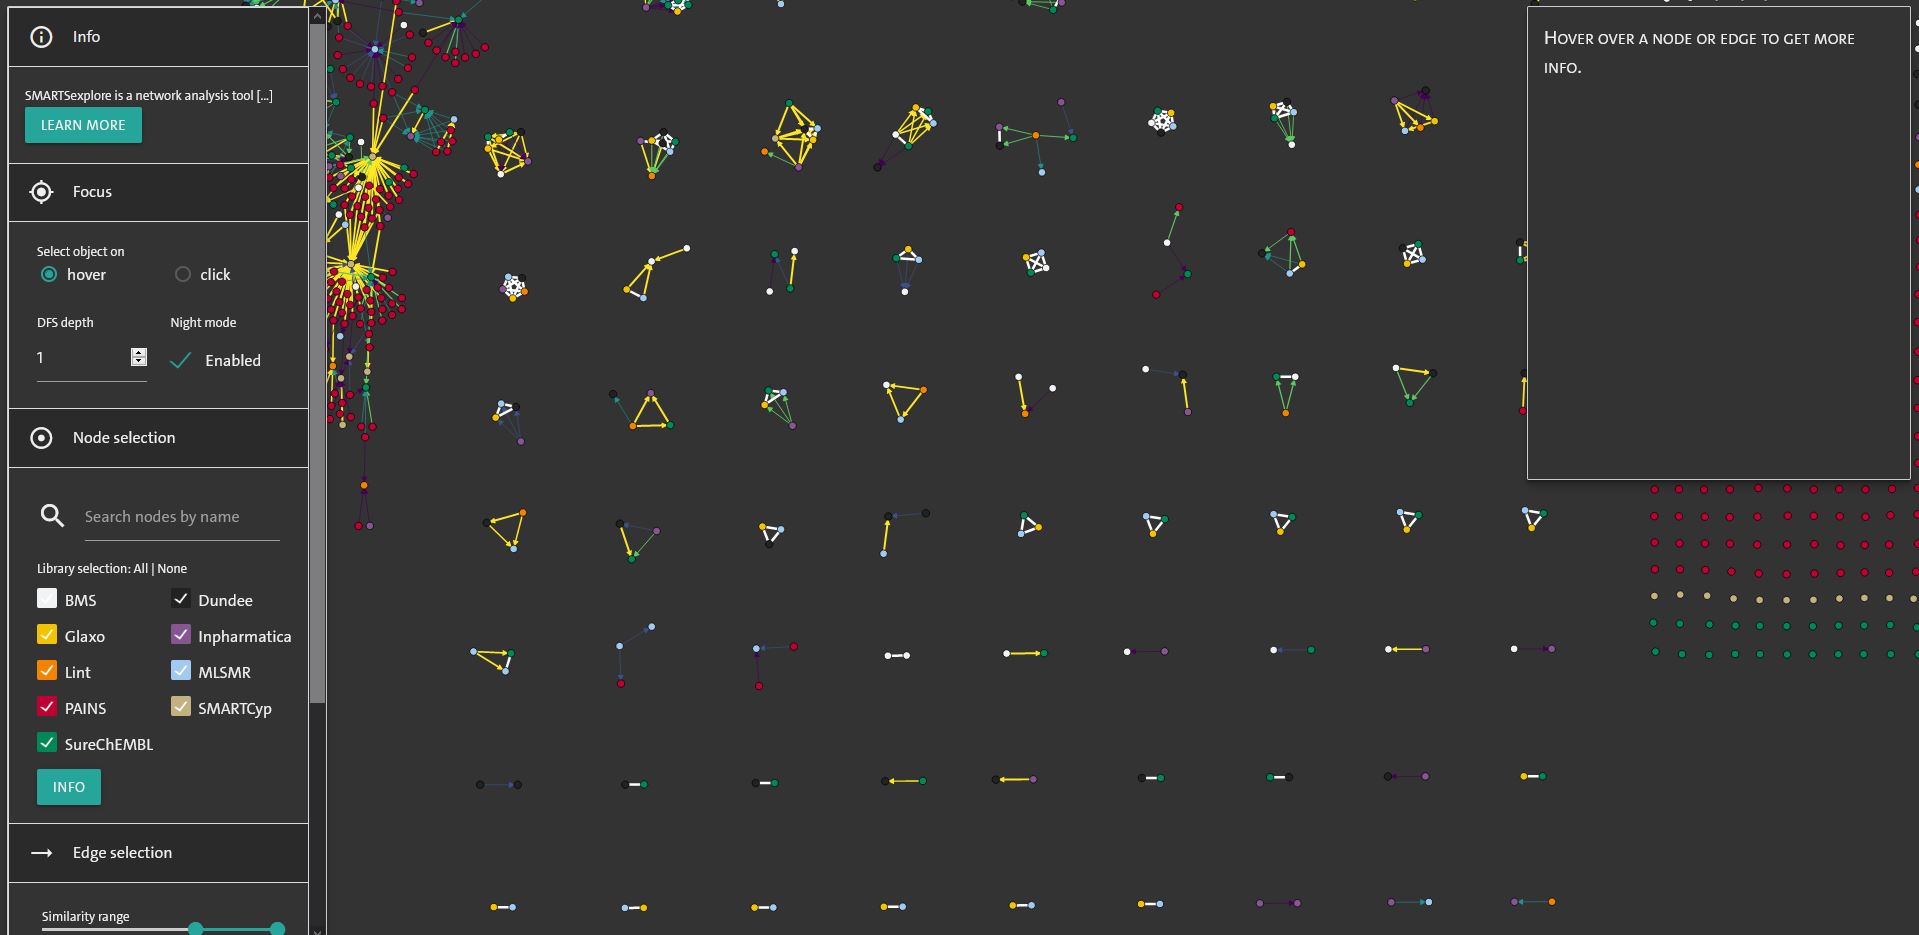
After you open SMARTSexplore in your browser, you will be presented with a webpage containing three sections: The network graph of SMARTS in the middle, the information container on the right side, and the settings container on the left side.
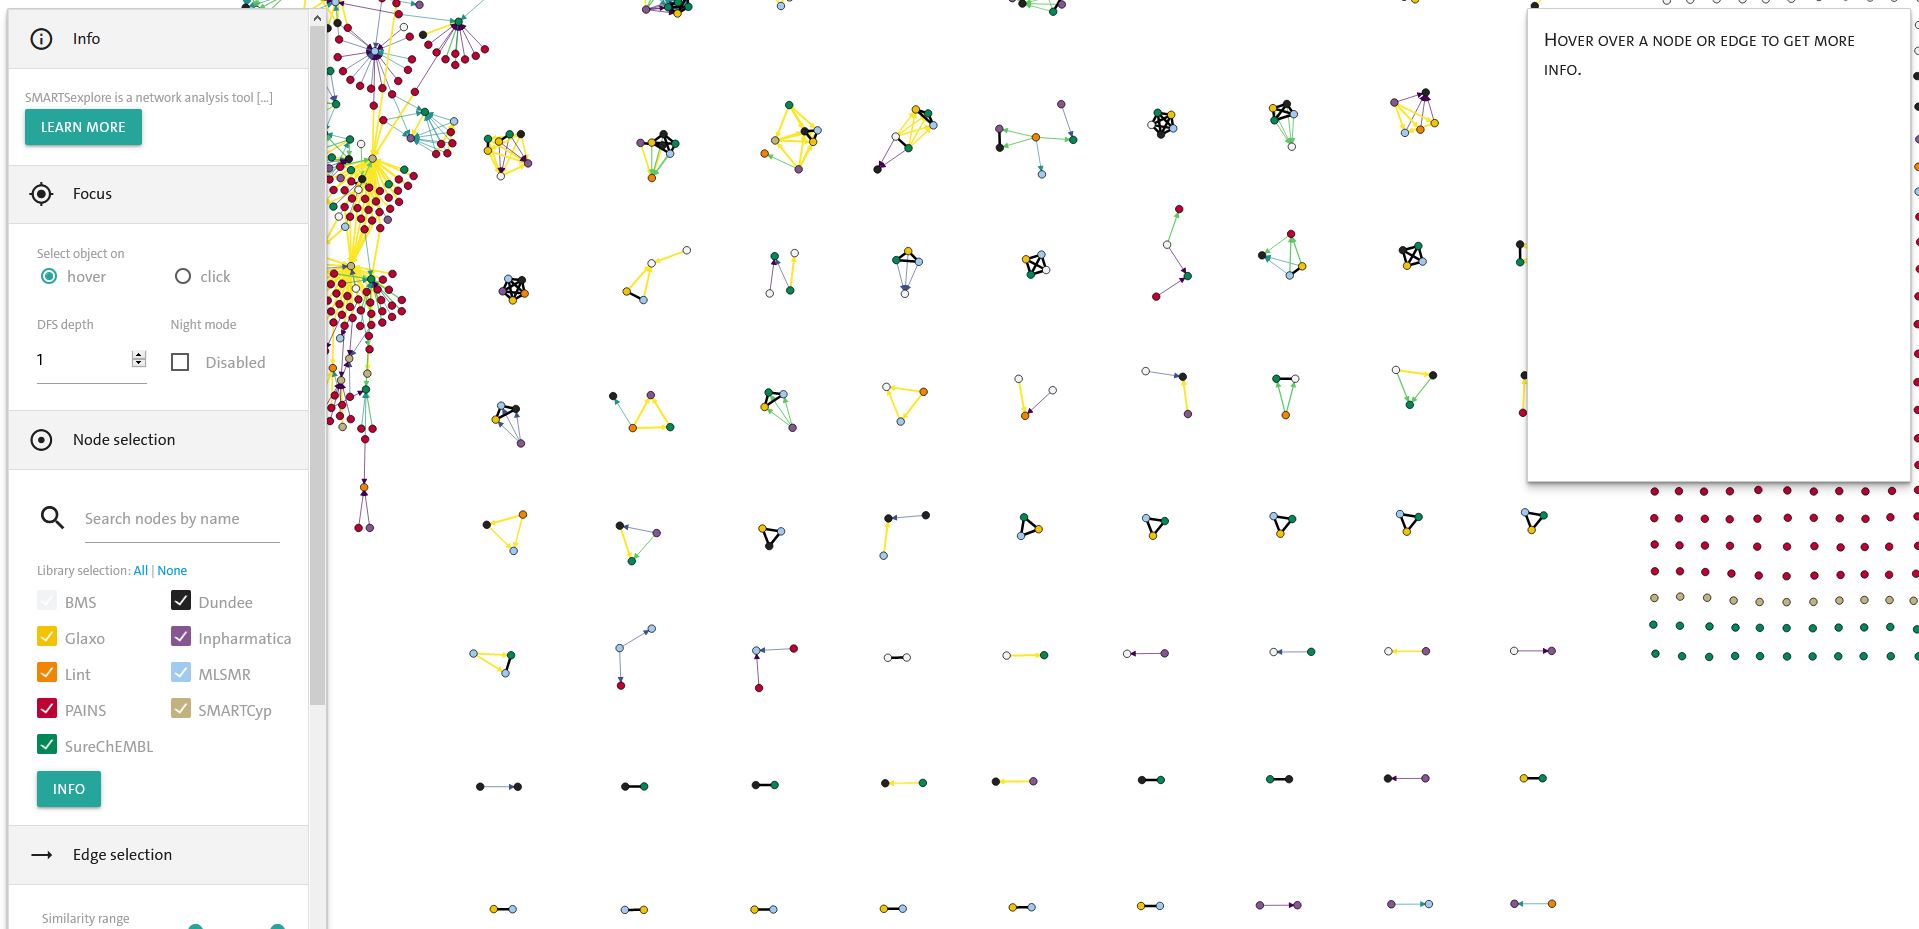
Graph Options
The SMARTSexplore graph shows SMARTS from various libraries and their similarities represented by different edges. Edges that are not contained in the similarity range (see: Settings - Edge Selection) are not shown. Edges shown have their similarity represented with a color scale where black edges depict identical SMARTS.
Dragging nodes
You can adjust the layout of the SMARTSexplore graph however you wish by dragging nodes. Just click on a node, hold and pull it wherever you want it to be. You can free nodes again by double-clicking on it.
Zooming
Zoom in and out the graph to get a clearer picture of the connections by scrolling.
Hovering
Hover over nodes and edges to get more information. You can change this setting to only show information by clicking on edges or nodes in the Focus section of the settings (see: Settings - Focus).
Panning
Click on the background of the graph and pull the image to the place you want.
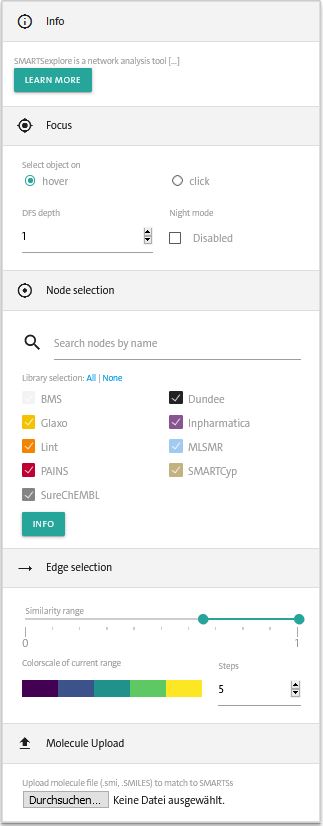
Settings
The settings container consists of five sections: Info, Focus, Node Selection, Edge Selection and Molecule Upload.
Info Button
The first section contains the info button that shows a basic introduction to SMARTSexplore when clicking on the button.
Focus
The second section is called Focus, because it allows the user to focus on specific parts of the graph. Nodes and edges can either be selected on hover or click depending on the selection (here: hover selected). Furthermore, SMARTSexplore allows for depth-first search exploration of the graph. By clicking on a node and pressing ctrl+alt the incoming edges or ctrl+shift for outgoing edges or ctrl+alt+shift for both types of edges at the same time are highlighted. The depth of the search algorithm can be changed according to the user’s needs.

On top of that, the Focus subsection allows you to enable nightmode that is disabled by default.
Node Selection
Node selection allows you to select the nodes you want to see - whether it is specific libraries or specific nodes.
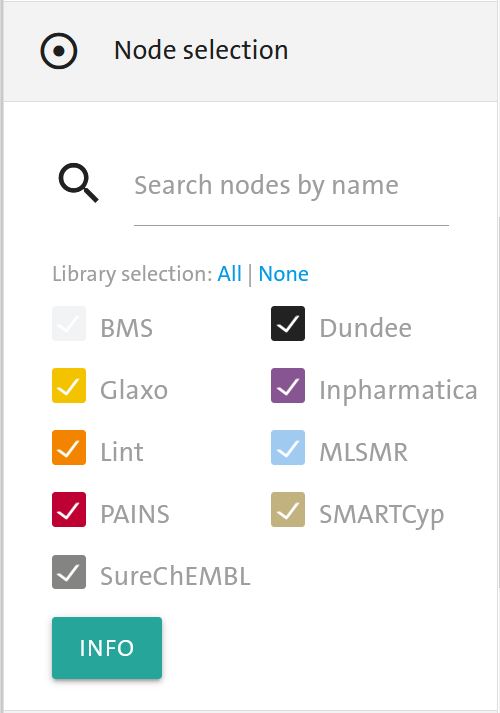
With the search box you can search SMARTS patterns by name. It also allows for the use of regex( (ch|qu)inone).
Note
Note that even though the search box allows you to search for certain SMARTS, it only searches in the name describing the SMARTS, not the SMARTS pattern itself.
By clicking on the tick boxes you can enable or disable libraries, by clicking on ‘All’ or ‘None’ you can enable or disable all libraries. The colours of the checkboxes stand for the colours of the libraries as shown in the SMARTSexplore graph. The info button underneath the libraries gives more detailed information about the libraries and contains their references.
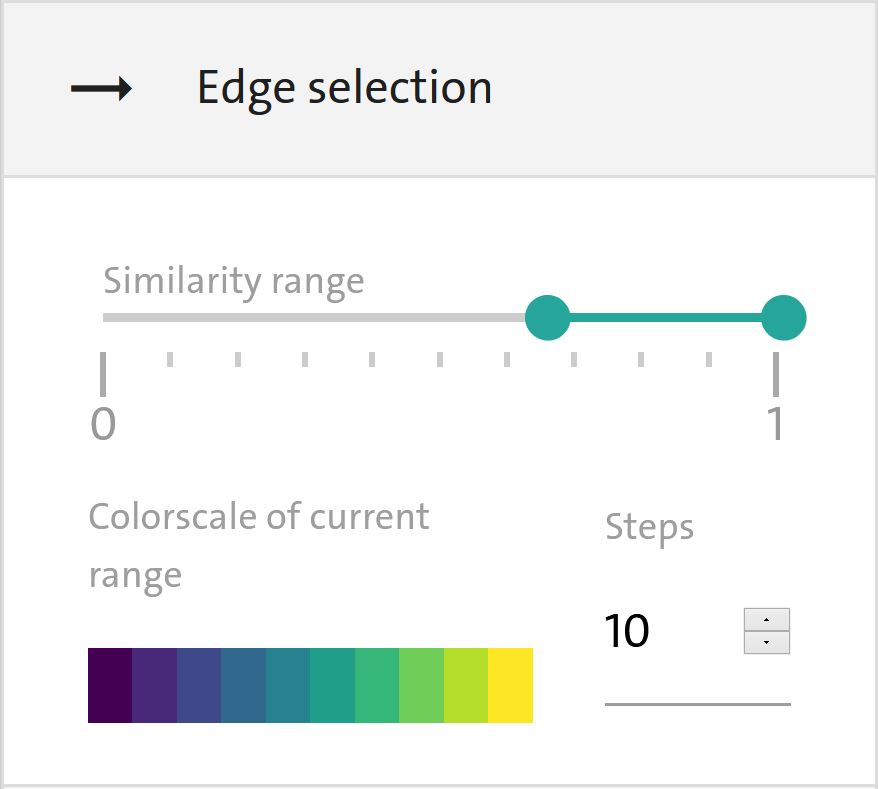
Edge Selection
Edge selection allows you to select which edges you want to see and how you want to see them. By default edges with a similarity between 0.65 to 1.0 are shown.
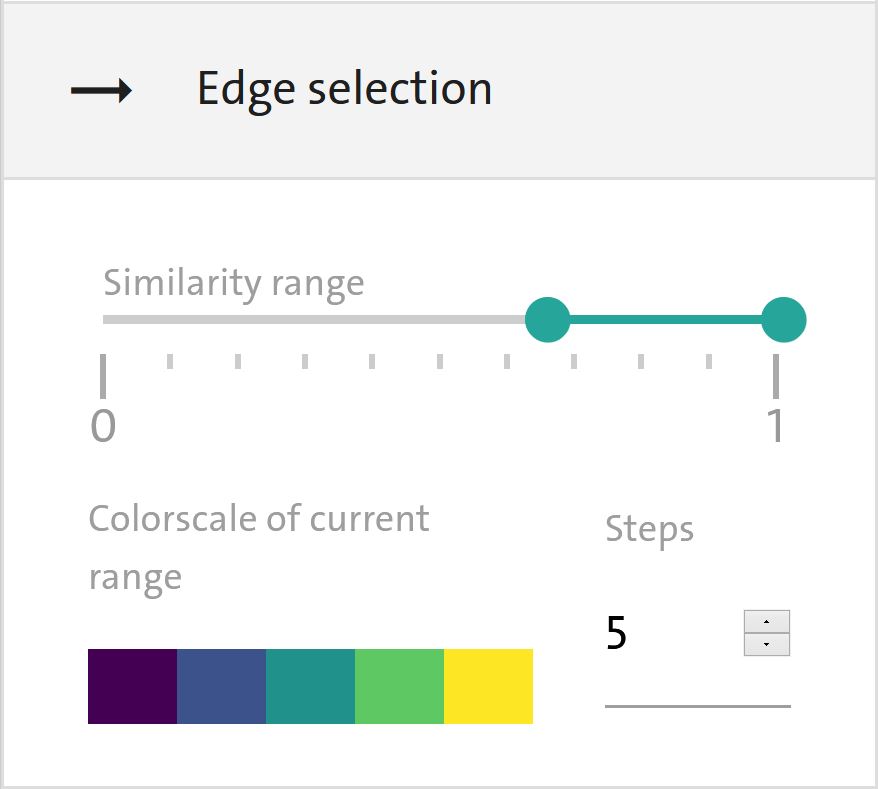
The range slider allows you to change this default selection and selects edges that fall in the chosen similarity range. This similarity range is then depicted over the colorrange.
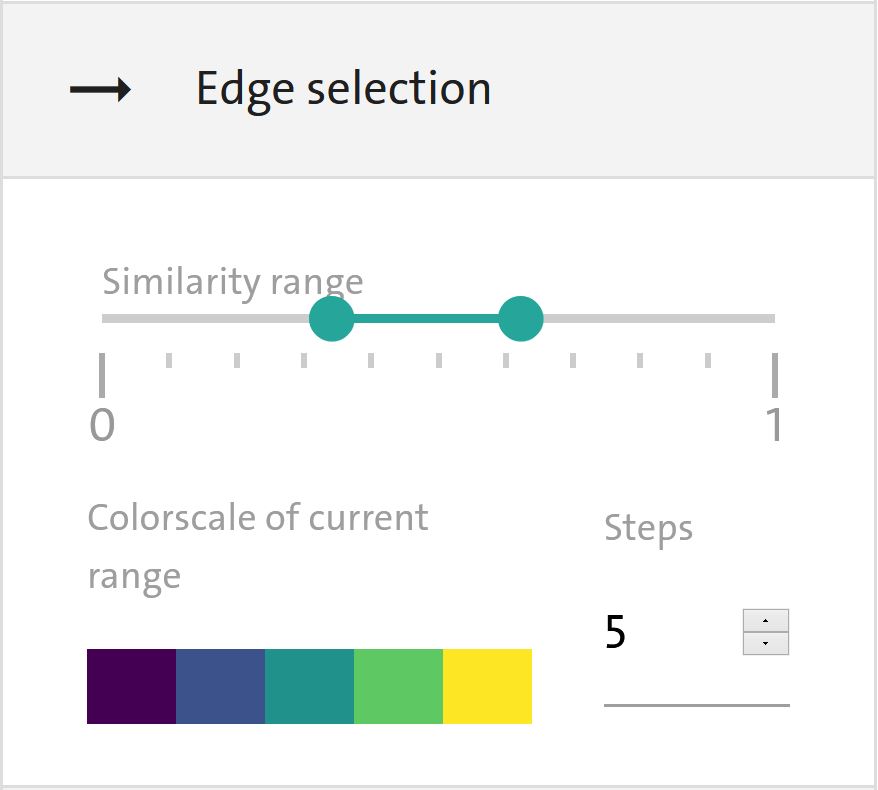
You can also change how granular you want the colors to be shown - the more steps you select, the more finetuned your colorscale becomes. This can make it easier to distinguish edges with very similar similarity values.
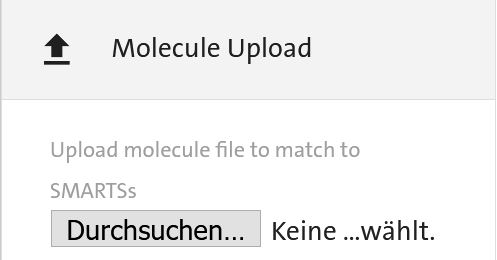
Molecule Upload
In this section, you can upload a .smi or .smiles-file that contains molecules that you want to match with SMARTS.
Warning
SMARTSexplore only works sufficiently fast for up to 250 molecules total contained in your molecule file. Above that SMARTSexplore becomes significantly slower.
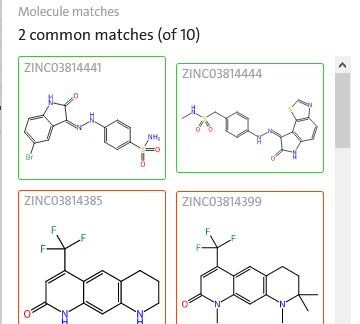
Once you uploaded your molecule file all SMARTS that match molecules will be highlighted from lighter shades of orange to red. The intensity of the color depends on how many molecules are matched with your molecules. A SMARTS that matches all your molecules contained in your file will appear red.
Furthermore, the information container (see information container in next section) now shows you additional information what molecules are matched by a SMARTS and, if looking at an edge, what molecules are matched for both SMARTSs connected (in green) and what molecules are only matched by one of the SMARTSs (in red).
Nightmode
As mentioned before, you can also enable nightmode in the focus section of the settings container.
Information container
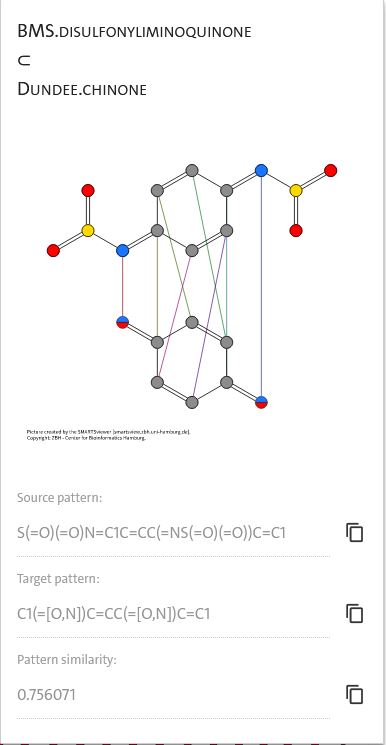
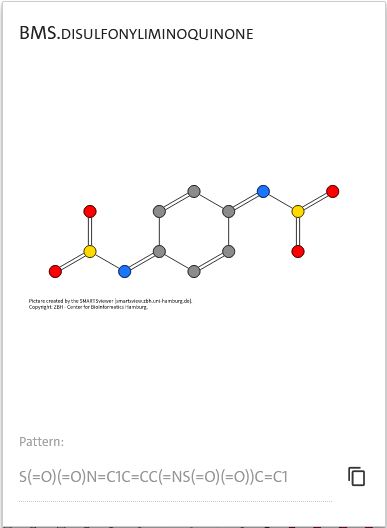
The information container visualizes edges and bonds between nodes. For nodes, it will show you a visualisation of its SMARTS pattern and the pattern of the selected node. The pattern can be copied to the clipboard by clicking on the icon.
For edges, it will show you a visualization of the two SMARTS connected and lines will show you which atoms between the two patterns match.
The two SMARTS patterns are shown under Source pattern and Target pattern depending on the direction of the edge. Both patterns can be copied to the clipboard by clicking on the icon. Furthermore, the similarity of the SMARTS pattern can be seen under pattern similarity. Again, by clicking on the icon, you can copy the number.